Weight calibration plots, optionally versus a covariate
weitrix_calplot.RdVarious plots based on weighted squared residuals
of each element in the weitrix.
weight*residual^2 is the Pearson residual for a gamma GLM plus one,
as used by weitrix_calibrate_all.
weitrix_calplot(
  weitrix,
  design = ~1,
  covar,
  cat,
  funnel = FALSE,
  guides = TRUE
)
Arguments
| weitrix | A weitrix object, or an object that can be converted to a weitrix
with |
|---|---|
| design | A formula in terms of |
| covar | Optional. A covariate. Specify as you would with |
| cat | Optional. A categorical variable to break down the data by.
Specify as you would with |
| funnel | Flag. Produce a funnel plot?
Note: |
| guides | Show blue guide lines. |
Value
A ggplot2 plot.
Details
This function is not memory efficient. It is suitable for typical bulk data, but generally not not for single-cell.
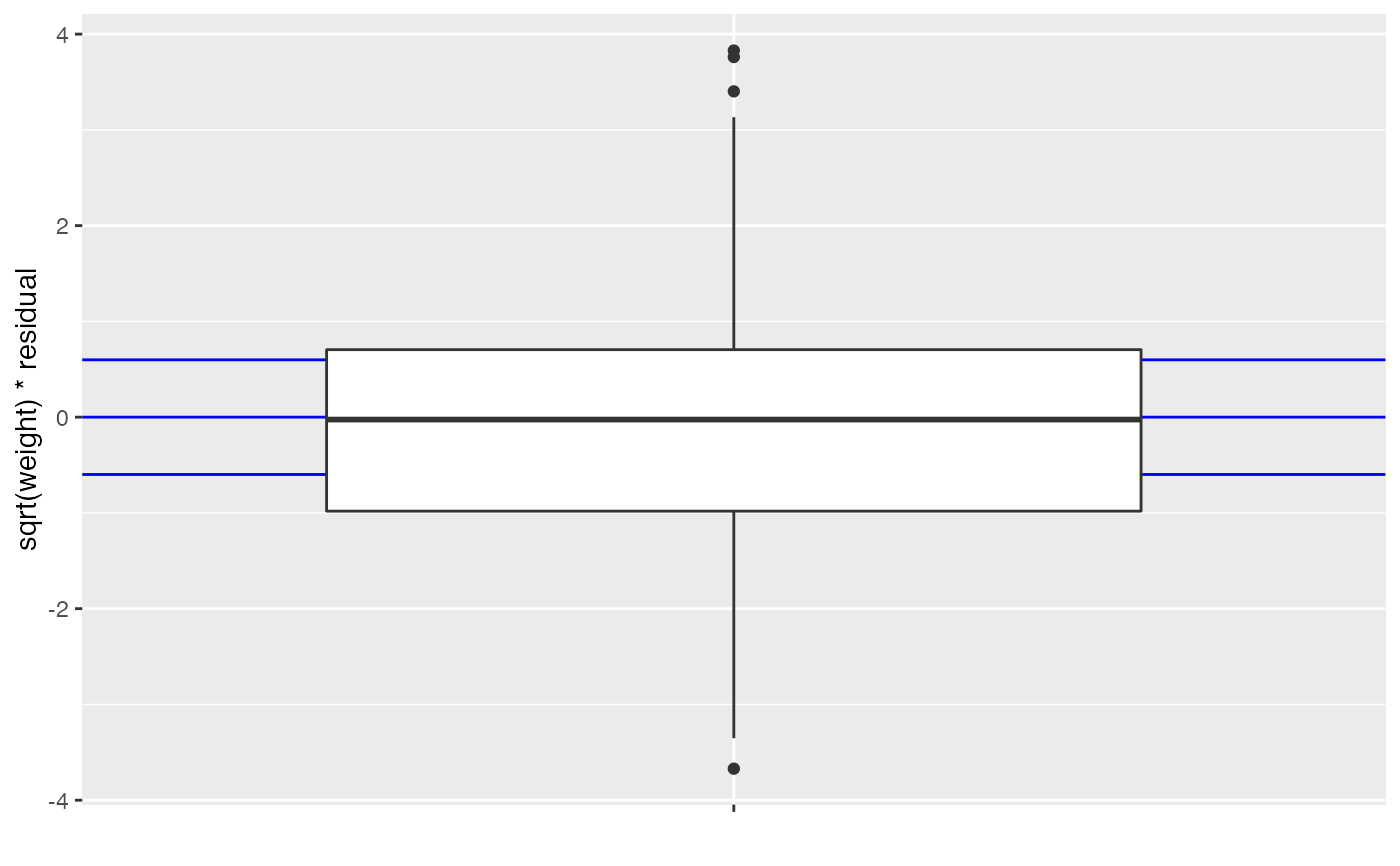
Defaults to a boxplot of sqrt(weight) weighted residuals. Blue guide bars are shown for the expected quartiles, these will ideally line up with the boxplot.
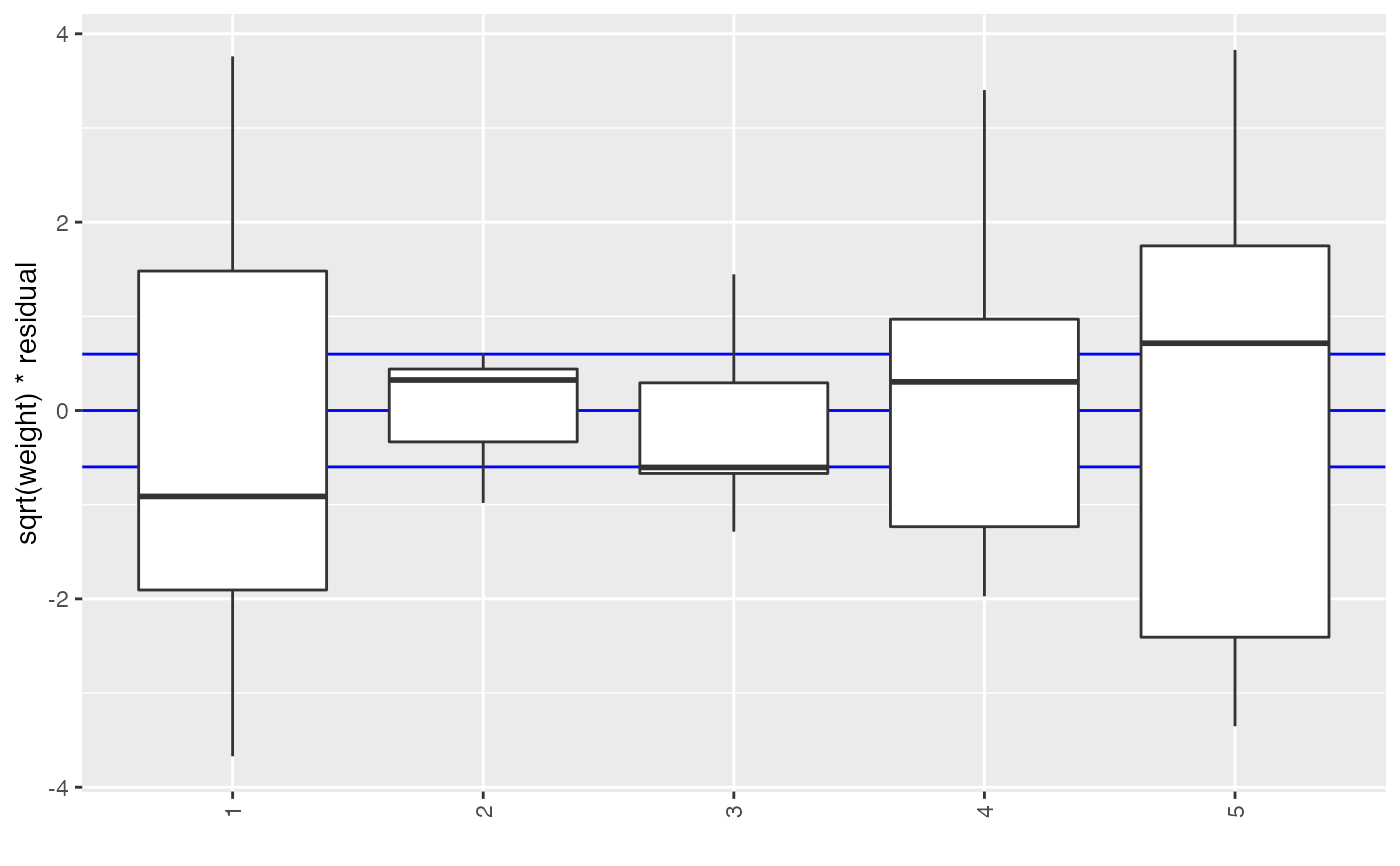
If cat is given, it will be used to break the elements down
into categories.
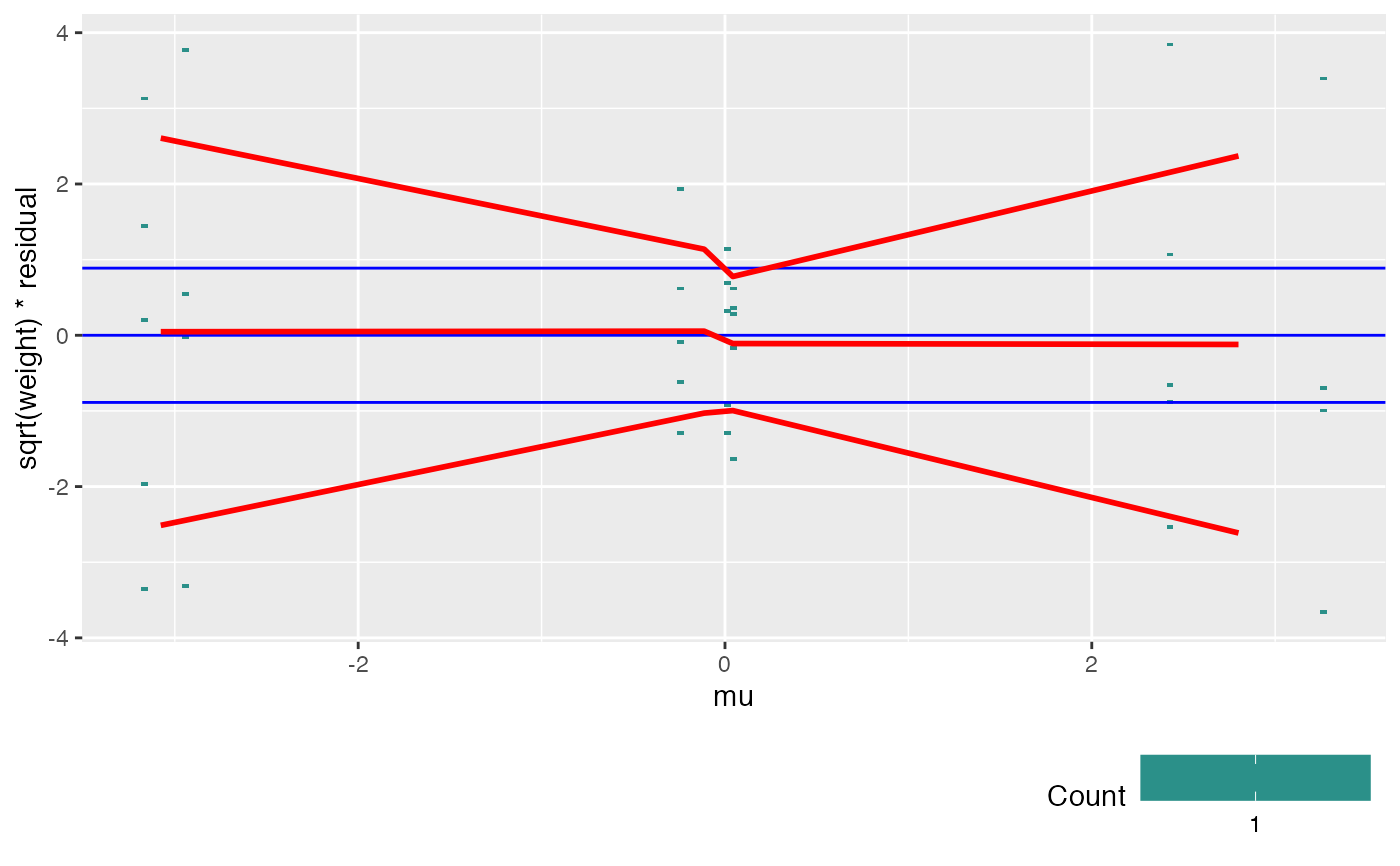
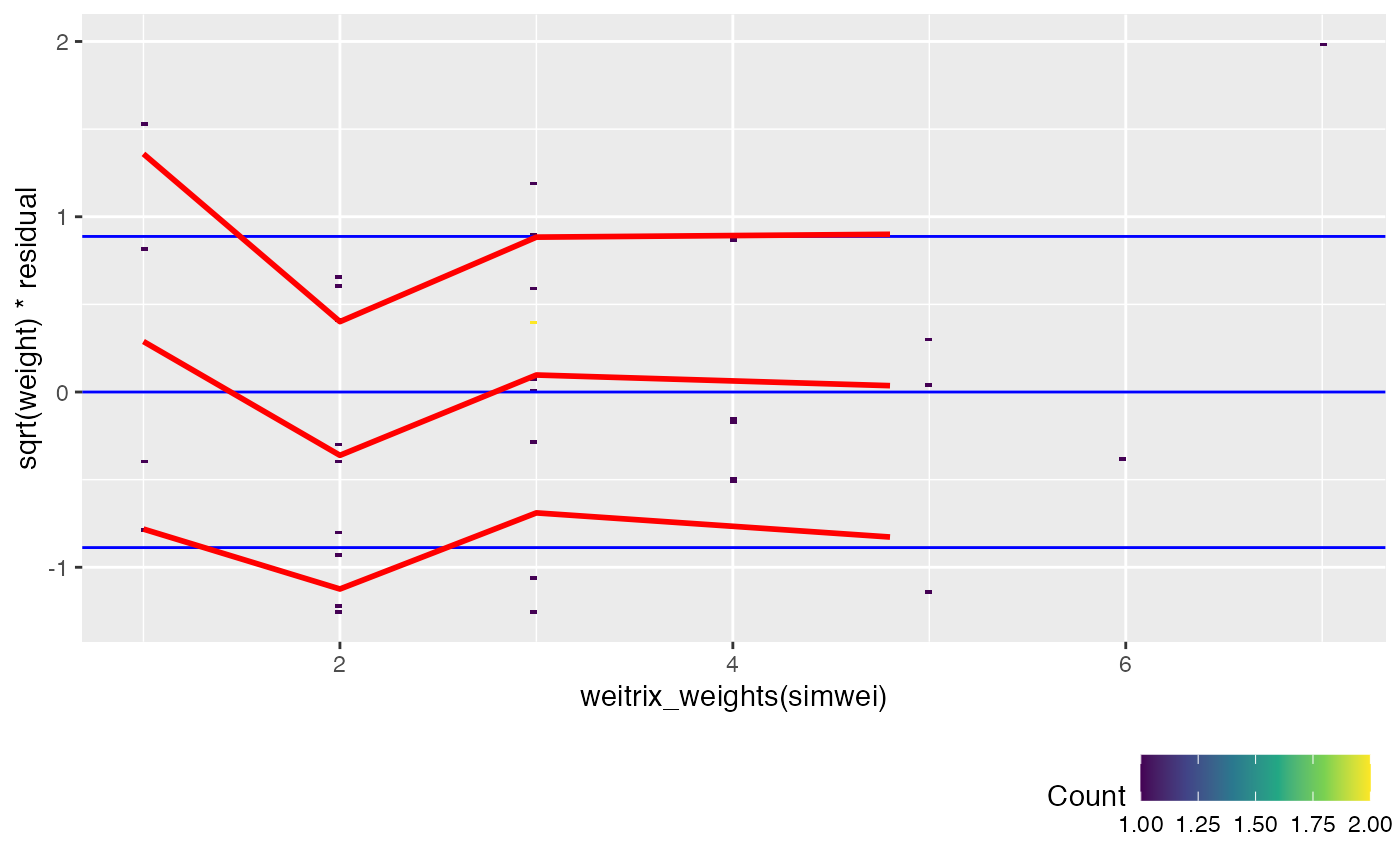
If covar is given, sqrt(weight) weighted residuals are plotted versus
the covariate, with red trend lines for
the mean and for the mean +/- one standard deviation.
If the weitrix is calibrated, the trend lines should be horizontal lines
with y intercept close to -1, 0 and 1.
Blue guide lines are shown for this ideal outcome.
Any of the variables available with weitrix_calibrate_all
can be used for covar or cat.
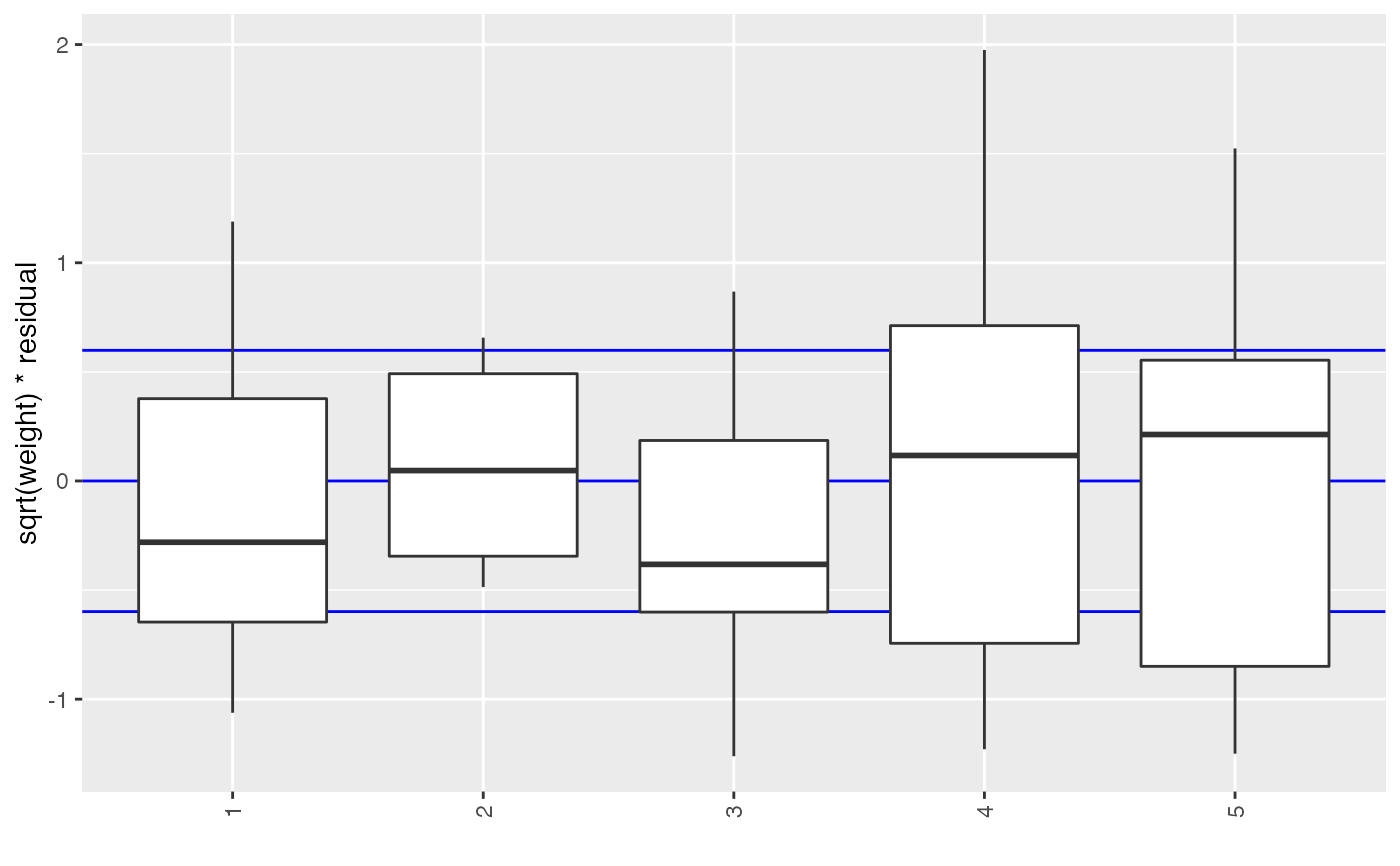
Examples
weitrix_calplot(simwei, ~1)weitrix_calplot(simwei, ~1, covar=mu)weitrix_calplot(simwei, ~1, cat=col)# weitrix_calplot should generally be used after calibration cal <- weitrix_calibrate_all(simwei, ~1, ~col+log(weight)) weitrix_calplot(cal, ~1, cat=col)# You can use a matrix of the same size as the weitrix as a covariate. # It will often be useful to assess vs the original weighting. weitrix_calplot(cal, ~1, covar=weitrix_weights(simwei))