Mouse brain cells
Single-cell RNA-Seq gene expression of 2,816 mouse brain cells (Zeisel, 2015). The top 10 principal components were produced using the steps in the Bioconductor OSCA workflow. This is unscaled PCA of log(normalized_count+1) expression levels, mean UMI count 15,550 per cell. So units of distance can be explained for example by genes with log fold change each.
data(zeiselPC)
palette <- rainbow(7, v=0.75)
langevitour(
zeiselPC[,-1], zeiselPC$type,
levelColors=palette, elementId="brain1")Try setting the guide to .
Examine particular cell types in detail by the other cell types.
Get a 3D effect by .
Mouse brain cells denoised
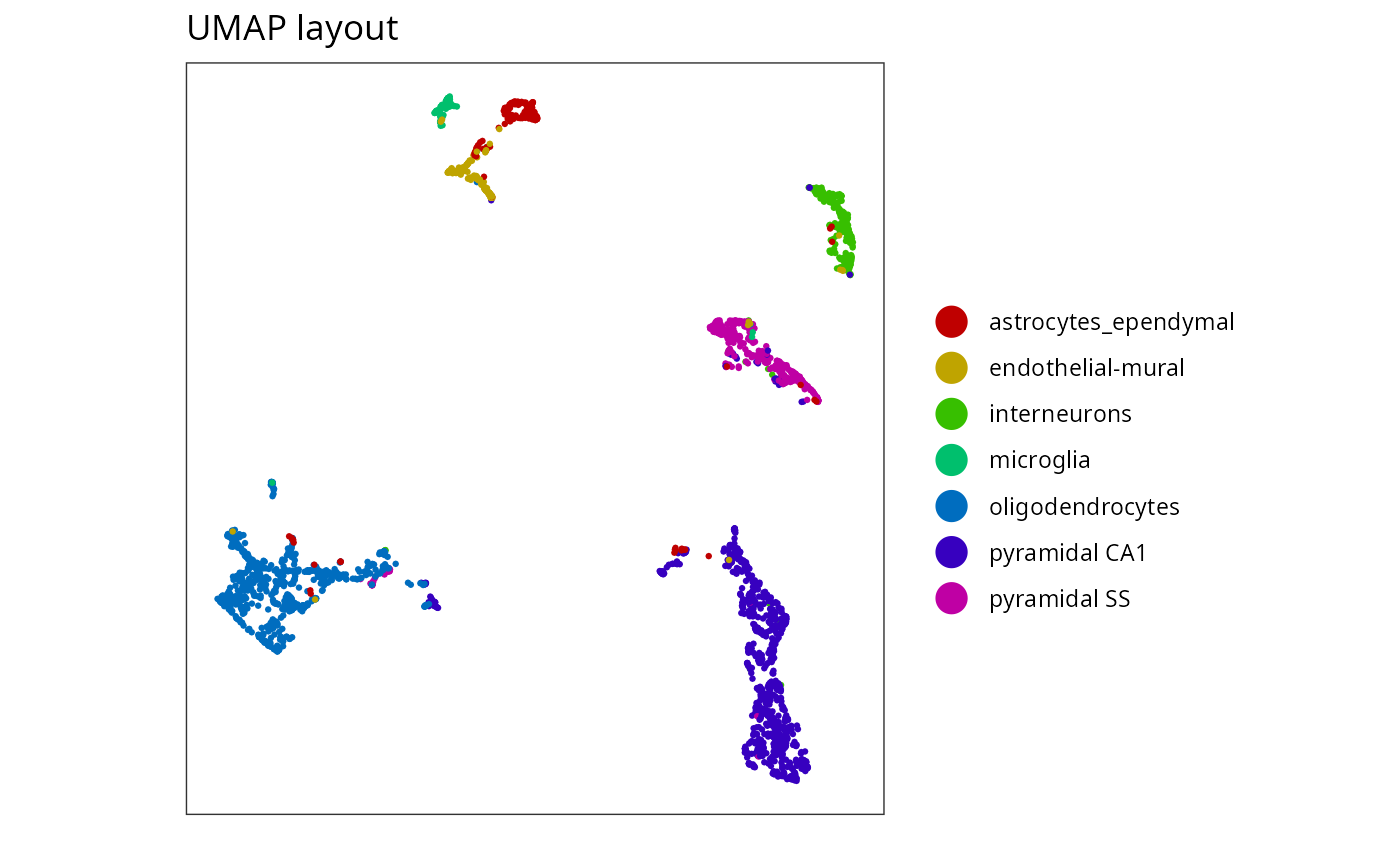
The single cell data is noisy. Typically this sort of data would be examined using a UMAP or t-SNE layout. The UMAP layout below looks very clean. Can we achieve something similar?
My current suggestion to reduce noise is, for each point, to take the
average of cells reachable in a certain number of steps along the
directed k-nearest neighbor graph. See the function
knnDenoise().
zeiselDenoised <- knnDenoise(zeiselPC[,-1], k=30, steps=2)
langevitour(
zeiselDenoised, zeiselPC$type,
levelColors=palette, elementId="brain2")Try setting the guide to . Ultralocal mode may need some fine-tuning of settings to work nicely, such as turning down the heat.
Notice that interneurons and the pyramidal CA1 and SS neurons parallel each other. This was not clear in the UMAP layout above.
Construct a separating all the clusters by dragging PC labels onto the plot. ()
Mouse brain cells denoised vs original
The denoised version looks much better, but is it a faithful representation of the data?
UMAP and t-SNE can produce arbitrary distortions and ripping apart of nearby points. Langevitour will only ever present linear projections of data, avoiding this problem. We should have a faithful view of the data so long as our denoising step is also relatively faithful to the original.
Let’s compare the original and denoised versions. You can judge for yourself if the original geometry is faithfully retained.
Olive oils
A dataset from the tourr package.
By default, langevitour does not scale variables individually. This dataset rather requires scaling, so we supply our desired scaling.
I also demonstrate adding extra axes representing principal components.
olives <- tourr::olive[,3:10]
olivesScale <- apply(olives, 2, sd)
olivesGroup <- paste(tourr::olive$region, tourr::olive$area)
# Find principal components
pca <- prcomp(sweep(olives, 2, olivesScale, "/"), rank=2)
olivesPC <- sweep(pca$rotation, 1, olivesScale, "/")
langevitour(
olives,
group=olivesGroup,
scale=olivesScale*6,
extraAxes=olivesPC,
pointSize=1.5)Hyper-cube
Some geometry from the Geo Zoo.
cube <- geozoo::cube.solid.grid(5, 1)
langevitour(
cube$points,
lineFrom=cube$edges[,"from"],
lineTo=cube$edges[,"to"],
lineColors=rainbow(nrow(cube$edges)),
pointSize=sqrt(seq_len(nrow(cube$points))))Torus
langevitour(geozoo::torus.flat(p=4)$points)pdfsense
A dataset in the liminal package. Each row has been scaled to a unit vector.
X <- as.matrix(liminal::pdfsense[,-(1:6)])
X <- X / sqrt(rowSums(X*X))
langevitour(X, liminal::pdfsense$Type)- Try setting the guide to “outliers”.
Stiefel manifold
The orthonormal projections of b dimensions onto a.
Stiefel manifolds are what langevitour tours!
stiefel <- function(a,b) {
k <- 5000
X <- matrix(nrow=k, ncol=a*b)
colnames(X) <- paste0("X[",rep(seq_len(a),b),",",rep(seq_len(b), each=a),"]")
for(i in seq_len(k)) {
mat <- matrix(rnorm(a*b), nrow=a)
decomp <- svd(mat)
mat <- decomp$u %*% t(decomp$v)
X[i,] <- as.vector(mat)
}
langevitour(X)
}
stiefel(2,3)
stiefel(2,2)