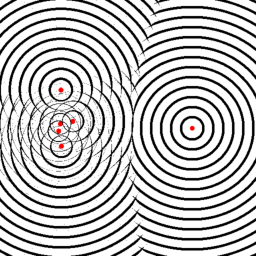
Following up on my new autism theory: I mentioned that use of the Gaussian distribution can lead to obsession with outlier memories. I can now illustrate this. In the pictures below, the red dots represent past observations (memories). The thickness of the ripples about these dots represent the likelihood of the oberservation being most relevant to different points in observation space.
| Cauchy | Gaussian |

|
|
Note how the outlier to the right completely dominates much of the space in the Gaussian case, and that only the borders of the cluster on the left have much influence outside of the cluster interior. Thus in novel situations a small number of outlier or border-case observations will dominate. This is not the case for the Cauchy distribution, where as one gets further and further from the observations they come to have more and more equal relevance.
Speaking more generally, the left hand diagram is more "muddled" than the right hand one. J.K. Rowling's term "muggle" seems appropriate. The right hand diagram is much more precise in its partitioning of space.
(A final note: a multi-variate Cauchy distribution is not rotationally symmetric. In the diagram above, it is star shaped with points aligned to the X and Y axes.)
statefulness...
Ok, so now look at this in terms of a simple Markov process. Say a person is remembering, perhaps daydreaming. No external inputs, pure feedback. Their state at any given time is one of the observations. The probability of their moving to a given observation during a timestep is determined by the conditional probability for the new state given the old state. Quite often the person will stay in the same state, but they will every so often wander to a different state. This will happen most frequently in tightly packed clusters, less frequently in outliers. And, obviously, a normal person will be far more likely to jump away from an outlier than an autistic person.
Also far more likely to jump to that outlier I should add. So this would predict that obsessive episodes will tend to have an external cause (possibly non-obvious), rather than being spontaneous.
Anyway the autistic person is more modal, doesn't jump between clusters easily. If this generalizes to autistic people being more modal in general (a big if), and if epilepsy is a pathological brain mode, then autistic people would have a higher chance of getting stuck in such a mode. Normal people might ocassionally glitch, but would recover pretty quickly. ... hmm, this is an incomplete account of epilepsy. I think a full account would require multiple memories in mind at the same time, and some form of interaction that could give rise to pseudo-randomness.
one thing i brushed under the carpet is the size of the distribution about each of the points. I basically just chose a value that looked good.
One way to choose this size would be to choose the size such that sum_i -log( sum_j,j!=i f_j(x_i) ) is maximized, where f_j is the distribution about observation x_j.
To formalize this theory (so as to avoid the possibility of being able to explain *anything* by twisting it this way or that) (I realized the following is presented in a manner that is largely incomprehensible): I am positing that various cognitive processes are based on use of a mixture model a la Snob, with the form of distribution of continuous values per class different between autistic and normal (Gauss vs Cauchy). These distributions may be multivariate, with dimensions related within classes (eg as per multivariate Gaussian distributions, or hidden factor analysis). Such a model can be sliced to form predictions: given that dimension one equals such and such, what value might dimension two take. For example, given that size==42 what values might name-of-animal take? (The diagrams above are a representation of such a slicing: given values of two continuous variables which values of a discrete variable are likely?)
I further posit that sometimes a random walk is taken based on such models, for processes such as memory recall and coming up with a list of examples. This probably takes the form of given dim1=A, dim2=B, given dim1=B, dim2=C, etc [1]. It may also simply take the form of a Metropolis-Hastings style random walk, in which case the step distribution will follow the same distribution as class distributions (this is known to lead to optimal sampling).
[1] Epilepsy being explained by a relation dim2 approximately equal to dim1 times some factor exceeding one. A random walk then leads to exponential blow-up (and thence non-linear effects as tolerances are exceeded). This is more likely in autistic people because an outlier with this property will remain relevant as the brain heads off to infinity. In a normal person other classes, hopefully lacking the exponential blow-up relation, will come into play as one heads to infinity.